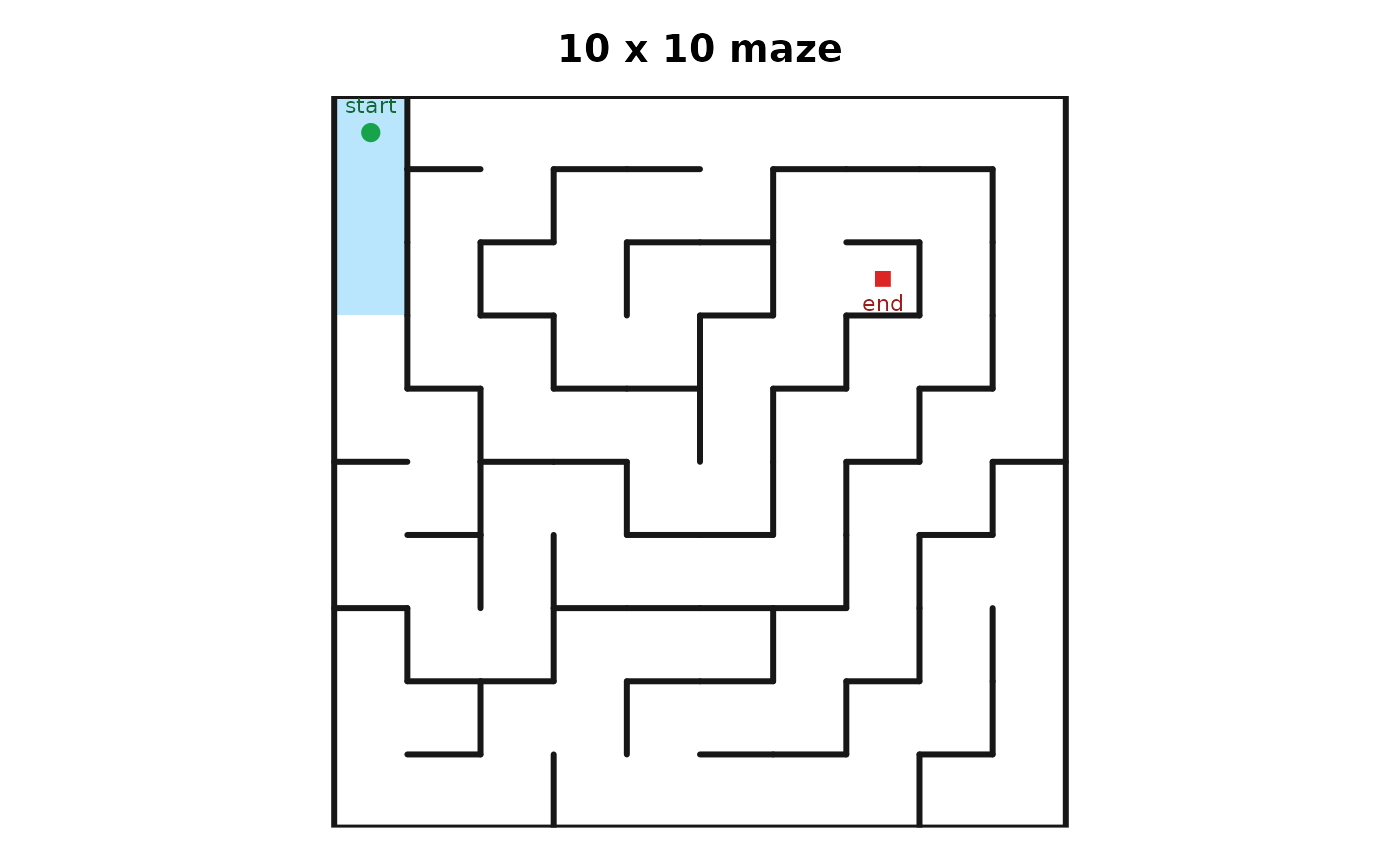
Plot a maze
plot_maze.RdDraws a maze with base R graphics. The generation traversal or a solved path can optionally be overlaid on the passages.
Usage
plot_maze(maze, solution = NULL, show_path = FALSE, show_nodes = FALSE,
  wall_color = "#171717", background_color = "white", wall_width = 3,
  path_color = "#8b5cf6", solution_color = "#f59e0b", path_width = 2,
  cell_fill = NULL, mark_endpoints = TRUE, main = NULL)

# S3 method for class 'maze'
plot(x, ...)
Arguments
- maze
A
mazeobject returned bygenerate_maze().- solution
Optional two-column matrix or data frame returned by
solve_maze().- show_path
Draw the complete generation traversal. Only available for mazes generated with
algorithm = "dfs".- show_nodes
Number the cells in the generation traversal. Only available for mazes generated with
algorithm = "dfs".- wall_color, background_color
Colors used for walls and cells.
- wall_width
Width of wall lines.
- path_color, solution_color
Colors used for optional path overlays.
- path_width
Width of path overlays.
- cell_fill
Optional data frame with
row,columnandcolorcolumns. The named cells are shaded before the walls are drawn, which is howanimate_solution()paints the explored cells and the frontier.- mark_endpoints
Mark and label the start and end cells.
- main
Plot title. Defaults to the maze dimensions.
- x
A
mazeobject.- ...
Additional arguments passed to
plot_maze().
Examples
maze <- generate_maze(10, 10, seed = 42)
plot_maze(maze)
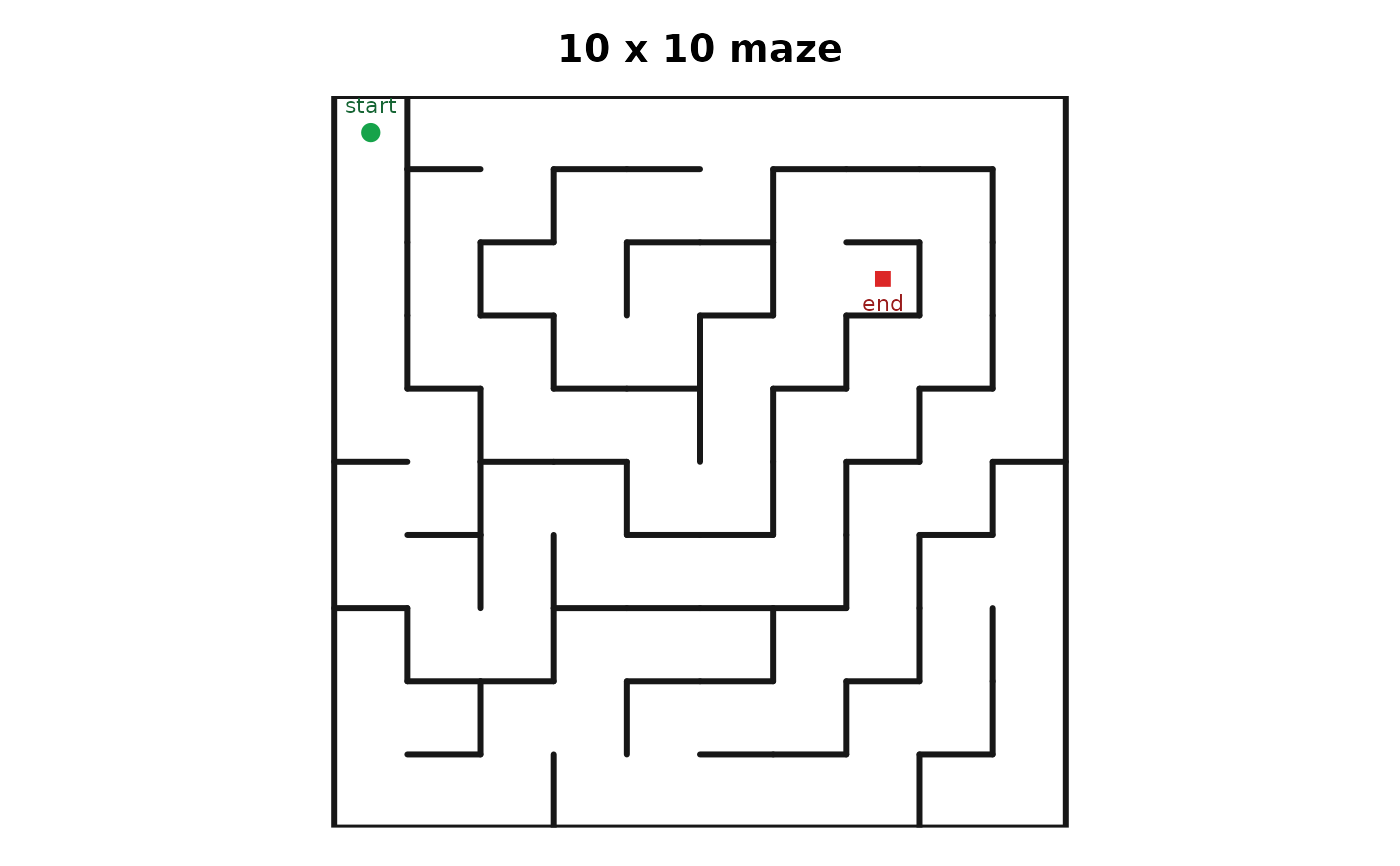 plot(maze)
plot_maze(
maze,
cell_fill = data.frame(row = 1:3, column = 1L, color = "#bae6fd")
)